← Back to Cities Built for Human Beings
Research findings

Simple estimation of greenery in Malé City

Satellite imagery analysis of green cover across Malé and Hulhumalé, with a literature overview of urban heat island effects, cooling thresholds, and thermal comfort.

Public Policy Lab · Hulhumale, Maldives · ◷ 5 min read
12 – 16%
Green cover in Malé proper
30 – 45%
Northern Hulhumalé Phase 1
40%
Threshold for greatest cooling effects
1.4°C
Cooling per 10pp increase in tree cover

The concentration of buildings, roads, and other artificial surfaces causes cities to absorb and retain more heat than surrounding rural areas – a phenomenon known as the Urban Heat Island (UHI) effect. This effect is particularly pronounced in dense urban centres like Malé. This report analyses the current state of greenery coverage in Malé and Hulhumalé, using scientific literature to contextualise the impact of this coverage on urban temperatures and human thermal comfort.

This brief covers a straightforward approach for measuring greenery cover, at the cost of some accuracy, designed for getting quick results without very high-definition satellite or drone images. It is suited to organisations without the resources to send teams for on-site mapping, and to situations where finer details and irregularly shaped small plants or shrubbery might have to be omitted in grid-based studies.

Methodology

Satellite imagery pixel analysis

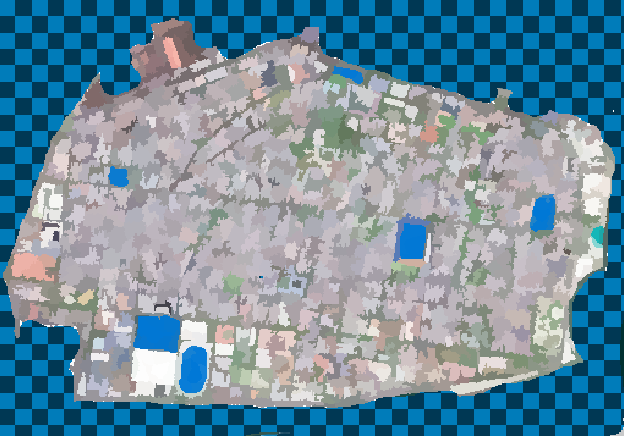
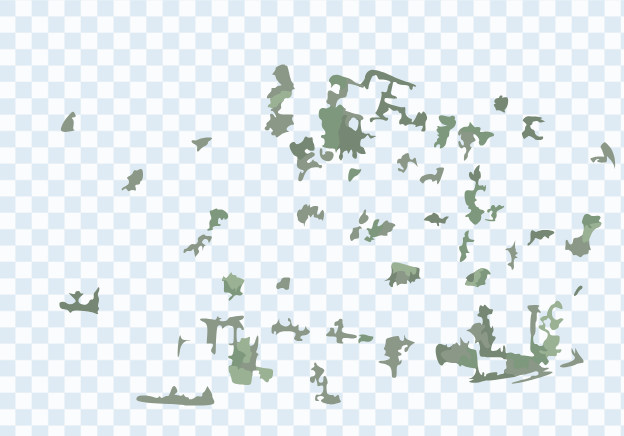
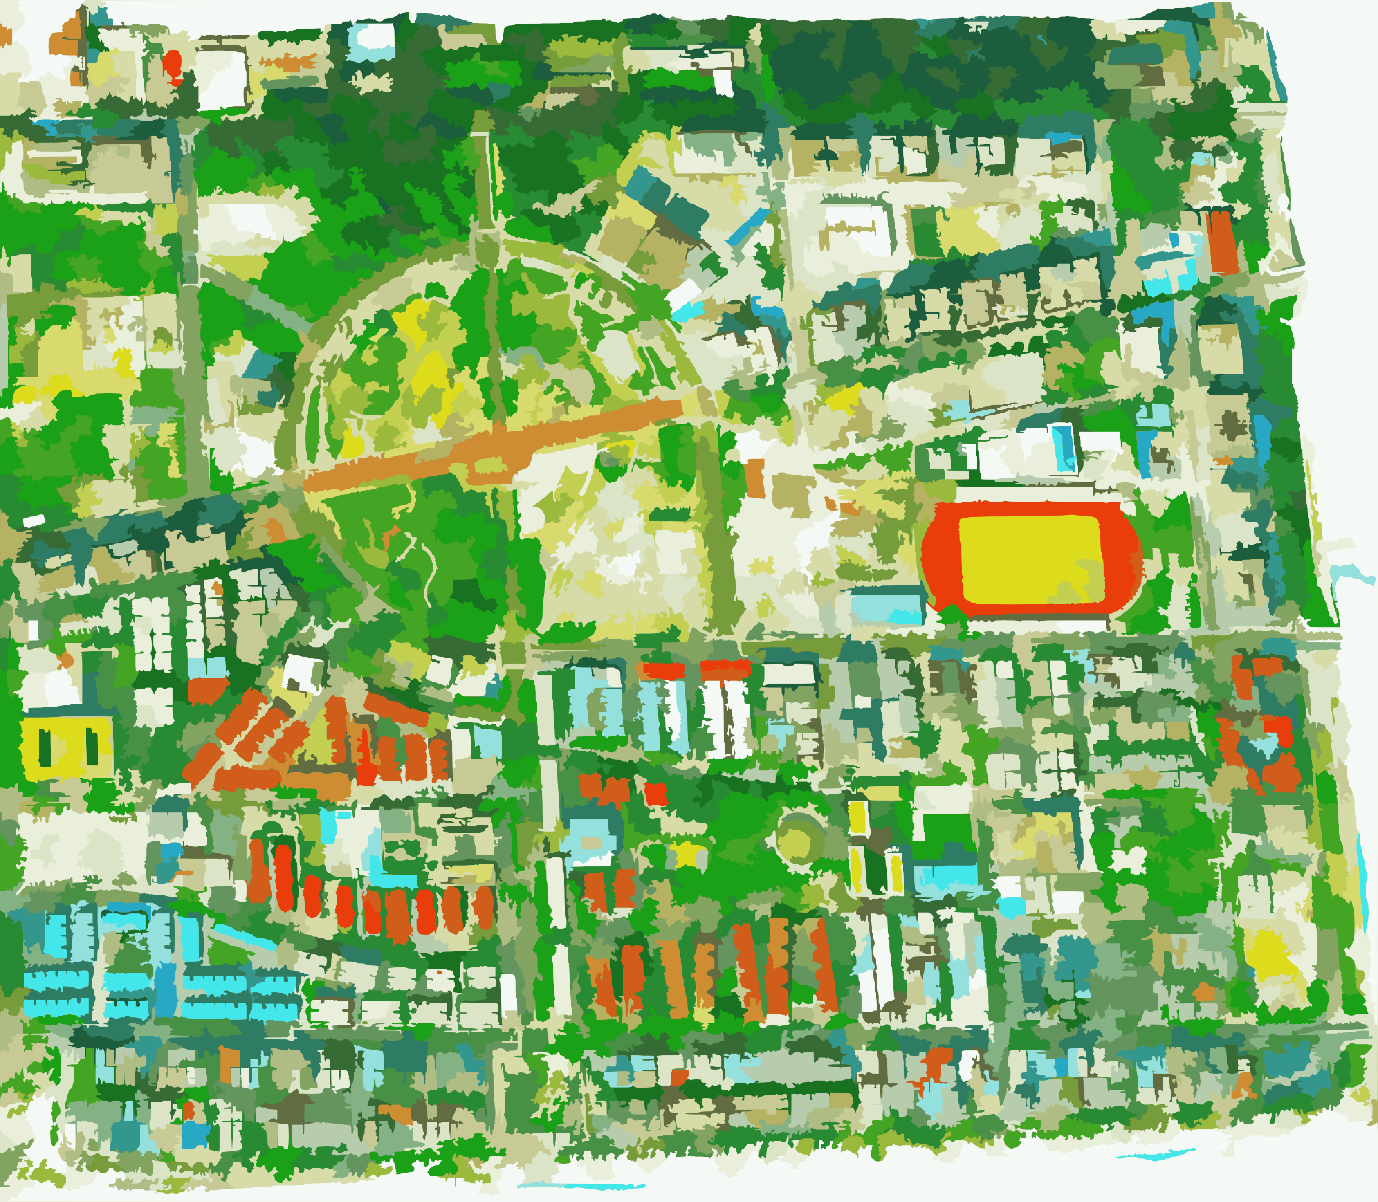
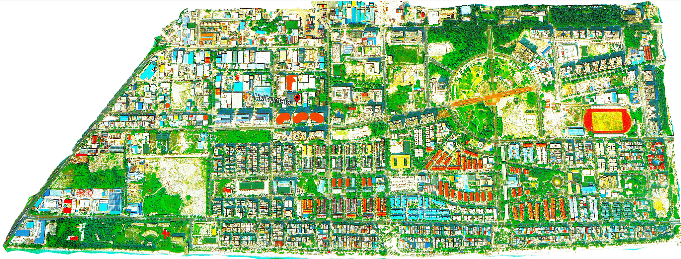
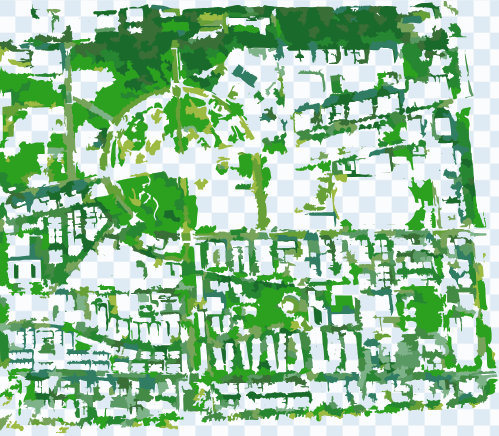
The greenery coverage was calculated using a multi-step analysis of satellite imagery. The process involved vectorising satellite footage into coloured polygons, deleting non-land areas like the sea, and manually correcting the colour of polygons that appeared green but were not vegetation (e.g. green rooftops). The final percentage was derived by taking a full pixel count of green pixels against the total land area pixels.

1
Vectorise satellite imagery
Satellite footage is converted into coloured polygons, reducing continuous imagery into discrete colour regions that can be individually classified and counted.
2
Remove non-land areas
Polygons representing the sea, lagoon, and other non-land surfaces are deleted, leaving only the island land mass for analysis.
3
Correct false positives
Polygons that register as green but are not vegetation – green rooftops, painted surfaces, artificial turf – are manually identified and reclassified to avoid inflating the greenery count.
4
Pixel count
A full pixel count of green pixels against total land area pixels produces the greenery percentage. Different selections of borderline green shades produce a range rather than a single figure, reflecting the inherent uncertainty in colour thresholds.
Vectorised satellite view of Hulhumalé Phase 1 showing extensive green areas
Vectorised satellite imagery of Hulhumalé Phase 1
Green pixels extracted from satellite imagery showing vegetation coverage
Green pixels extracted from the satellite imagery
Findings

Green coverage across Malé and Hulhumalé

Malé
12.5 – 16.5%
Greenery coverage in Malé is significantly smaller and is mostly concentrated in a few specific locations: Sultan Park, Lonuziyaaraiy Park, and along the streets of Fareedhee Magu and Ameer Ahmed Magu. Different selections of borderline green pixels give percentages between 12.5% and 16.5%, with likelier numbers toward the low end.
Vectorised satellite view of Malé showing dense built environment with minimal green cover
Vectorised satellite imagery of Malé – greenery concentrated in Sultan Park and a few corridors
Green pixel extraction for Malé showing very sparse vegetation coverage
Green cover extraction for Malé – substantially less coverage
Hulhumalé Phase 1
21.8 – 31.8%
For Hulhumalé Phase 1 as a whole, different selections of borderline green shades give between 21.8% and 31.8%, with the likeliest numbers being around 25 – 28%.
Northern Hulhumalé
30.1 – 45.2%
For the primarily residential northern half of Hulhumalé Phase 1 (north of Orchid Maa Hingun), different selections of borderline green pixels give percentages between 30.1% and 45.2%, with the likeliest numbers being around the 35 – 40% mark. This is the only residential area of Malé City which meets the desired percent of urban greenery coverage for positive liveability impacts.
Vectorised satellite view of northern Hulhumalé showing high green coverage
Northern Hulhumalé Phase 1 – the highest green coverage in the city
Literature overview

What the research says about greenery and urban heat

The 40% threshold for optimal cooling
Scientific research indicates that the cooling benefits from trees are not uniform across all levels of coverage. A 2019 study found that the relationship is nonlinear, with the greatest cooling effects occurring when tree canopy cover exceeds 40%.1

Quantifiable cooling effects

Multiple studies have measured the direct impact of greenery on urban temperatures:

  • A linear cooling effect has been observed, with an approximate air temperature reduction of 1.4°C for every 10 percentage point increase in tree cover. Based on this model, Hulhumalé Phase 1's 20 – 30% coverage provides an estimated cooling of 2.8°C to 4.2°C. For the northern part of Phase 1, 35 – 40% coverage would provide an estimated cooling of 4.9°C to 5.6°C.
  • In streets with high-percentage tree cover, afternoon air temperatures can be reduced by up to 3.3°C, and mean radiant temperatures by 13.9°C, compared to similar streets with no shade.
  • Even artificial shading is effective. Umbrellas can reduce radiant heat exposure by 15 – 20%, and building-integrated shades or pergolas can reduce local temperatures by up to 2.1 – 3°C.

Human thermal comfort and health

The benefits of greenery extend beyond temperature reduction to overall well-being:

  • Planting dense canopy trees was found to reduce the mean radiant temperature (TMRT) by 35% and improve the Physiological Equivalent Temperature (PET), a measure of thermal comfort, by 25%.
  • The UHI effect exacerbates heatwaves, which are associated with increased mortality. Research from Sydney found that over 90% of heatwave days would not have breached official thresholds if there were no UHI effect. The study concluded that widespread tree planting can reduce urban heat and could help offset increases in heat-attributable deaths as the climate warms.
2.8 – 4.2°C

Estimated cooling from Hulhumalé Phase 1's 20 – 30% tree cover, based on a linear model of 1.4°C per 10 percentage points.

4.9 – 5.6°C

Estimated cooling for northern Hulhumalé Phase 1, where coverage reaches 35 – 40% – approaching the 40% threshold for maximum effect.

3.3°C

Reduction in afternoon air temperature in streets with high tree cover compared to streets with no shade – enough to change whether people walk or ride.

13.9°C

Reduction in mean radiant temperature in shaded streets – the measure that most directly affects how hot a person feels standing in the sun.

Conclusion

The gap and next steps

Hulhumalé's green spaces, with 20 – 30% tree canopy cover, provide a significant and measurable cooling effect that mitigates urban heat. Scientific literature clearly indicates that a target of over 40% canopy cover is necessary to achieve the most effective reduction of the Urban Heat Island effect. This percentage is found in the northern part of Hulhumalé Phase 1.

Malé's minimal greenery coverage leaves it highly susceptible to the negative impacts of urban overheating. In future research, we aim to measure ambient temperatures in various locations of Malé and Hulhumalé to identify whether recorded numbers match these estimates.

More precise analysis using higher-resolution imagery or ground survey methods would narrow the estimate range. The methodology used here is suited to rapid assessment and identifying the scale of the gap rather than producing precise figures.

1 Ziter et al. (2019), "Scale-dependent interactions between tree canopy cover and impervious surfaces reduce daytime urban heat during summer," PNAS. www.pnas.org/doi/10.1073/pnas.1817561116